Wednesday, September 25, 2013

Spoiler alert, not to scale

A phrase has entered into our conversation and it annoys me. "Spoiler alert." grrrrr.

I think it's a completely unnecessary thing to say and it sort of treats the person you are talking to (or at least someone within earshot) with pretty large amounts of disrespect. If you really care that some one does not hear what you are about to say....don't say it.

Further, if you are the person that doesn't want to know...walk away. If you really don't want to know, make it so that you can't know! You can probably detect that something is coming up that you might not want to hear, so act on it.

It's a lazy way of saying either," I acknowledge your opinion but I don't care about it so I'm telling you so that you can't blame me", or "I'm not strong willed enough to keep this information from myself, and will choose to blame you for not respecting my desires." I've even noticed people saying it to themselves.

The other thing that we are saying a lot is "Not to scale." It is the scientific/misconception equivalent and again, it annoys me.

If something is not to scale...Why? and if not, make it to scale. It really isn't that hard to do. It also sort of depends on the scale that you are talking. The picture of planets and our Sun for example. It is to scale (if you are looking at sizes), but nearly every time I see this, someone says, "this is of course not to scale."
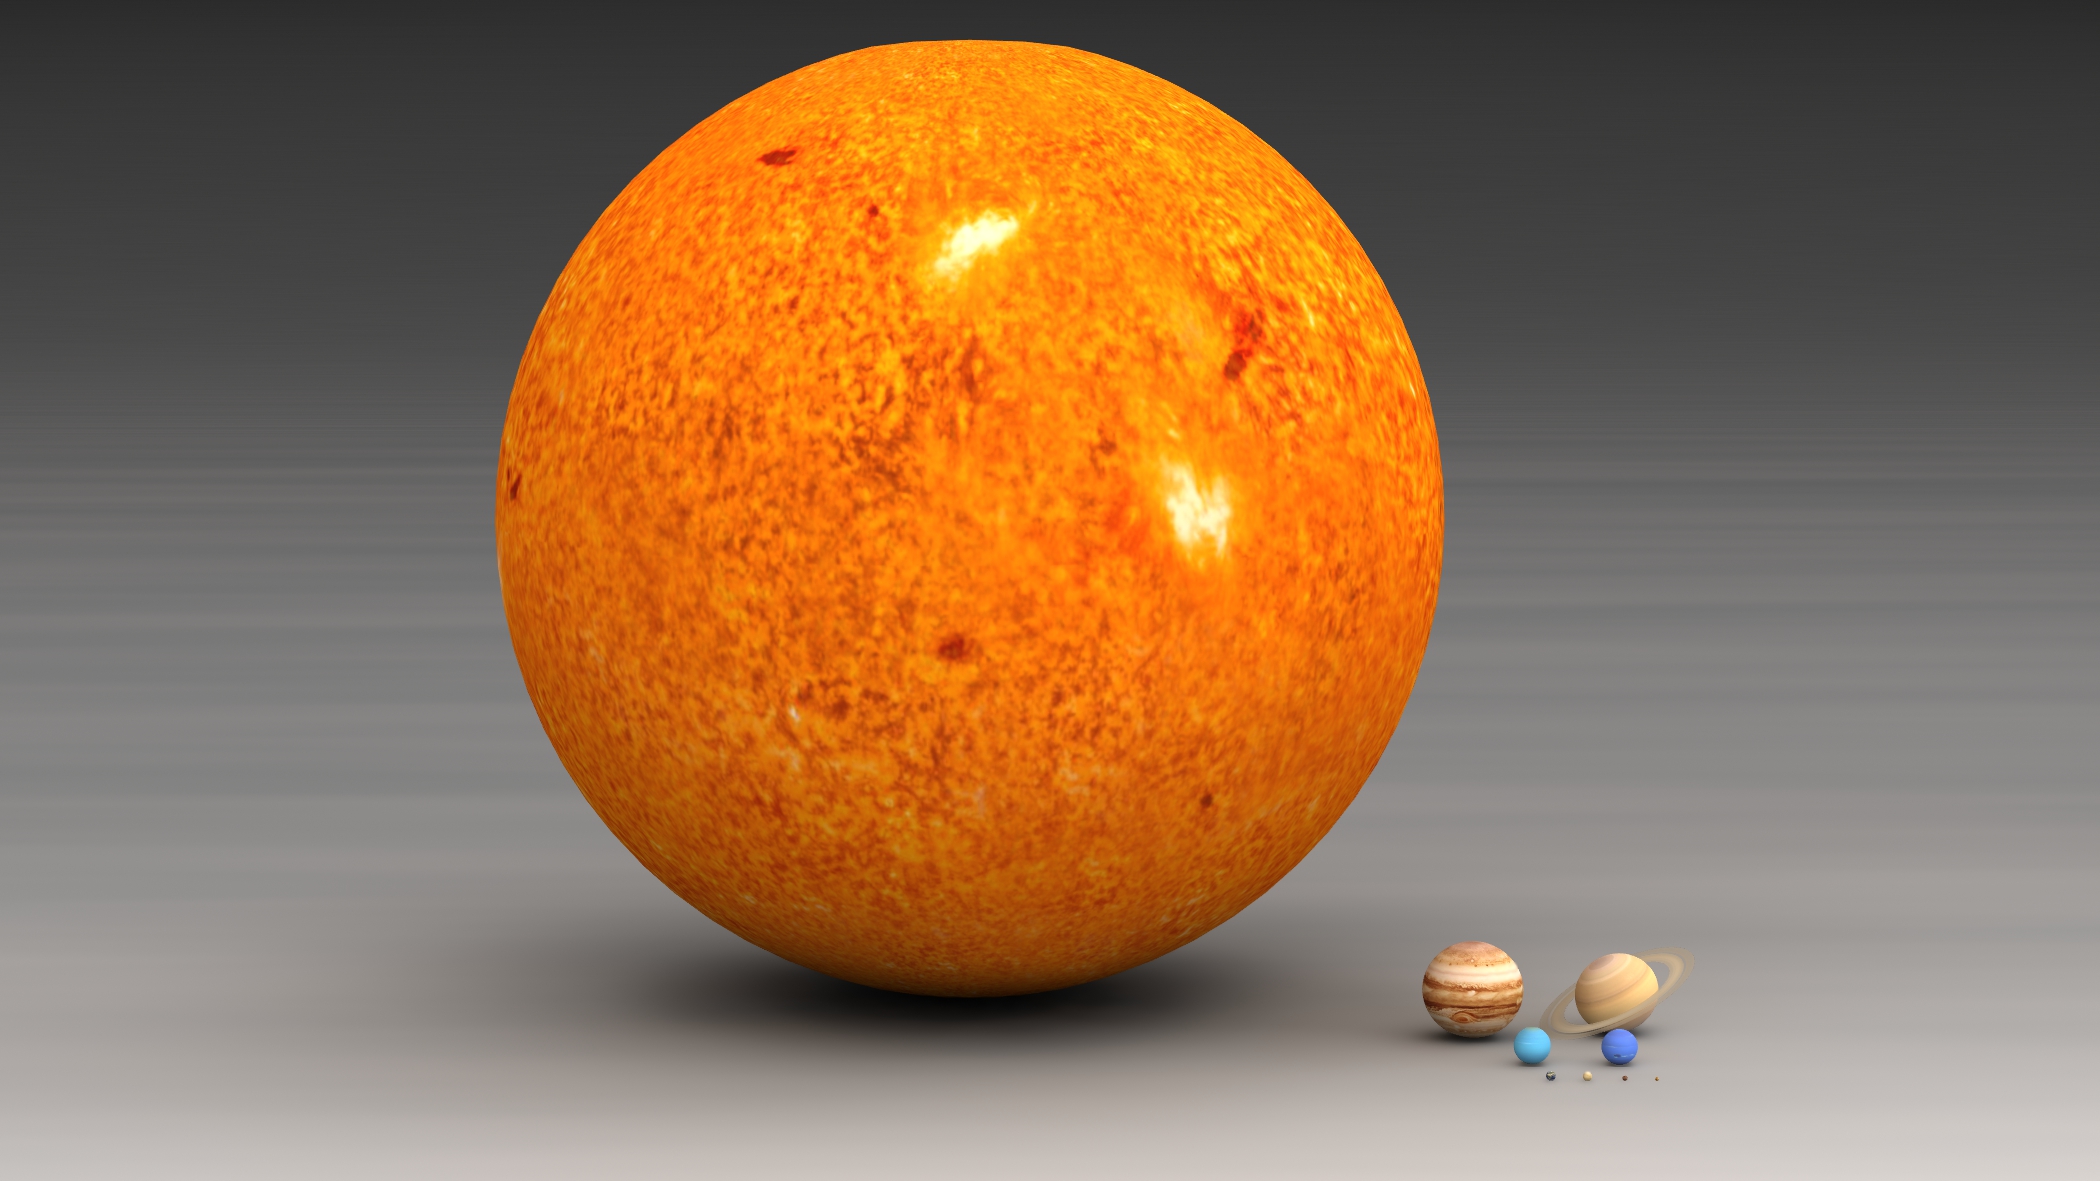
Exactly to scale
It's a cheap get-out-of-being-wrong card that I just don't like. "I'm right, but I'll cover myself so if I am wrong, I can say, I knew it and therefore be right about being wrong!"

Worse. You don't need to tell me that it's not to scale. I can sort of see that! Especially when we are talking about very large things like stars or universes, or very small things like molecules or atoms. I think the assumption can be made that what you are dealing with is things that are not to the scale of what they actually are. Or at least not a 1:1 scale.

When talking about a film or TV show or something and I know that someone is listening who might not want to hear. I won't say anything. If I did in error, and the person gets annoyed, I can always come back with, "hey, does it matter, it's a TV show!"or something.

When it comes to scales, we generally do explain or communicate things that are to scale, otherwise it would be useless to explain them that way.


Sunday, September 22, 2013

Teaching


As a teacher, I found myself on a few occasions teaching things like common sense, or how not to be foolish to some students more than science.

Teachers have an arsenal of classroom management techniques, some of mine included stopping what activity was being done and write things from the board, swapping groups, moving onto next activity, distraction, you know...the usual.

I realised however, that I was in a science classroom and I can use science to change the activity yet still using the topic or concept to say "Hey guys, get back on track," as well as "check this out, it's science, it's relevant"

Here are 3 examples of my science classroom management techniques where I got to investigate relevant science concepts as well as get the class back on task.

1. Peripheral vision
In a year 8 anatomy class, I noticed in my peripheral vision, some students were being less that model students. I stopped the activity and got them all to sit down. I asked the students to show me their best spirit fingers with their hands either side of their head about where their ears are, so that they couldn't see their hands. I asked the slowly move their hands forward (while still giving it some sparkle) until they could see their hands still looking forward.


Firstly, it is pretty amusing to see a whole class of year 8 students doing spirit fingers, and secondly, they have instantly realised that their peripheral vision is quite wide...and so is mine! I barely had to mention the fact that I could see what those students were doing. The message was effective and I got to talk about science in the process.

2. Total internal reflection
Very similar situation, but instead of using jazz hands, I used the door to the classroom that had a large glass panel in, opened in a way such that through total internal reflection, I could see what some of the students were up to. So, in a physics class on the properties of light, I could stop the class, talk about total internal reflection, then simply turn to the door and wave at the students behind me reflected from the door. Again, I didn't even need to mention the classroom management point of the excersise, that was fairly obvious, and so was the scientific one.

3. Waves
This technique wasn't really about showing the students they had done something wrong, just disrupting their disruptive behaviour. In the waves topic, I would get the students to create a mexican wave in class, complete with shouting etc! The beauty of this is that there are heaps of things like reflection, interference, refraction, speed, transverse vs longitudinal that you can do with waves. So each time I had to use the technique (which worked in terms of classroom management) I got to talk about something else to do with waves, and build upon what they had 'learnt' from last time.

I found myself looking to relevant scientific principals to make an educational point as well as a behavioural one. I think it worked too. The students would mess up less cos they weren't getting the usual teacher reaction and everyone involved got some unexpected science!

Monday, September 16, 2013

Standing waves

I like to see physics in strange places. Last week I took my kids to the local swimming pool and was mucking around in the kiddie pool with my youngest (he's 2). His mind was occupied with throwing a toy clown fish (he calls it Meemo, and I have to try and fight the urge to say "Found him"every time he throws it!) and the retrieving it again. So I tried a little experiment, and this one surprised me!

I talk about standing waves almost everyday to students that come through the Kickstart lab. It is such an important concept in Physics that I think I can spend a few minutes on what they are and how to make investigate them.

A standing wave is essentially 2 waves. both that interact with each other to create constructive and deconstructive interference. The result is a wave that seems not to move. The features and characteristics of a standing wave are different to that of a normal wave. A normal wave has a peak and trough, a speed you can measure by measuring it's distance travelled over time etc. A standing wave does not have these features. It has a node which is the bit in the middle that doesn't move, and the peaks and trough (they are the same thing) are called anti-nodes.

To create a standing wave, all you need to do is reflect a wave of a rigid surface (like the wall in this case) that is the same wave in the opposite direction.

Simple.

The cool bit was when I tried this in a swimming pool. You can make a wave in the pool with your hand, just move your hand through the water (close to the surface I guess) and you've got your wave. If you do the same with your other hand in the opposite direction you get interference.

This interference is the standing wave, and this is cool enough! but it gets cooler! I was mucking around with tis in the pool and looked up to see my son still throwing Nemo about and I caught in my peripheral vision the waves that I had created were still going long outside of where my hands created them, but they were not standing waves anymore. The brilliant thing about this is that I could see that my hands were creating separate waves that travelled along in their respective directions, it was only when they were interacting (between my hands) that they created a standing wave.

A very simple illustration of the complex physics of standing waves, that any one can do, and probably has done before. I love it, and next week when we go back to the pool, I'll be repeating my experiment while my son throws fish.


Wednesday, September 11, 2013

Do you get frustrated over time when trying to understand graphs?

Graph-iti
Here is my attempt at explaining graphs in Physics, and what they are for.

Ability to draw mountains over time
Graphs are really important. My opinion is that if a picture is worth a thousand words, then a graph can be like a whole thesis! I'll start with a very funny graph made by an excellent comedian Dmetri Martin. His graph (My ability to draw mountains over time) is a wonderful description of what a graph is an how it is helpful. It's at least a very good joke. Dmetri has had to understand what a graph is in order to make the joke, and to get it requires a similar mastery of graphing too.

You can tell that as time gets larger (that is as we move further away from time zero in this experiment) Dmetri's ability gets better. The thing that changes in this experiment is time so we put that on the x-axis and plot the thing we are measuring against the thing that changes on the y-axis. We can call these the independent and dependant variables if we like, but I wont. We could even start to make some predictions about Dmetri's mountain drawing abilities for some time further down the track, or we could draw a line of best fit through his data points in order to get an equation for his graph.

I see this as one of the main points for doing Physics. We do it to get data points that we can tabulate. Then we graph the tabulated data and from that graph, make predictions and fit equations. Once we have the equation for the graph, then we don't have to do the experiment again and in fact we can rearrange or manipulate the equation for our purposes.

Most equations we see have come from an experiment that tabulated and then graphed. When you look at a graph as simply an expression of tabulated data, or a pictorial representation of an equation, they start to make a lot more sense.

Hertzsprung-Russell Diagram
One of my favourite graphs is the astronomers version of the periodic table of the elements called the H-R digram. The H-R diagram plots the intensity of a stars light against it's colour or temperature. What this graph says to us is that the hotter the star is, the bigger it's intensity will be, makes sense right? Of course!

This graph however, is so much more than that. We know that stars evolve and as they get older they change their composition therefore change their temperature, which in turn will change their luminosity. This effectively means that the HR diagram is a plot of the life cycle of star. I can make predictions too. Tell the colour or luminosity of a star and I can tell you what sort if star it is and wether it is likely to go Supernova in it's lifetime or not. Pretty cool little graph.

I use graphs all the time to convey messages, i think they hold an immense power to communicate an experiment or outcome. If maths and equations are the language of Physics, then graphs are its poetry.